


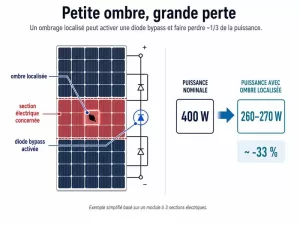
Partial Shading on Solar Panels: Why a Small Shadow Can Cause Major Power Losses
Introduction: Shading Is Not Just a Surface Area ProblemIn a photovoltaic system, a small shadow can be amplified by the electrical structure of the module. In a typical module with three electrical sections, a shaded area covering only a small part of the
From Half-Cell to Multi-Cut: Why PV Modules Are Paying More Attention to More Segmented Circuit Design?
Table of Contents In recent years, half-cell modules have become a mainstream design in the photovoltaic market. Compared with traditional full-cell modules, half-cell technology reduces the operating current of each cell unit, lowers internal resistive losses, and improves thermal management and partial shading
Does Summer Heat Reduce Solar Panel Efficiency? What Really Happens to PV Output
Table of Contents Many PV users notice an unusual phenomenon in summer: although sunlight is strongest at noon, the power curve shown in the monitoring app does not reach the expected peak. In contrast, on a sunny spring day, or just after a
Low-Carbon PV Procurement in France: Why ECS, PEP Ecopassport and Solar Carports Matter
Table of Contents France is becoming one of Europe’s most documentation-driven solar markets. For EPC companies, developers and commercial project owners, module selection is no longer based only on price-per-watt, efficiency or linear power warranties. Carbon documentation, supply-chain traceability and project-specific compliance files
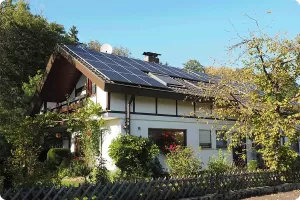
PV Module Installation Beyond Rooftops: Multi-Scenario Applications for Bifacial N-Type Modules in Europe
PV module installation is not limited to rooftops. For residential users, small commercial users and distributed PV projects in Europe, spaces such as balconies, gardens, fences, carports, terraces, façades and pergolas can also provide additional installation areas when conditions allow. As solar use
Europe’s Grid Cap Era: Why High-Efficiency Solar Panels Matter More in 2026
Introduction In 2026, the economics of distributed solar in Europe are changing. Grid congestion, export limits, negative electricity prices and zero-export requirements mean that a solar project can no longer be judged only by how much electricity it generates. The more important question