
Table of Contents
Introduction
As autumn and winter arrive, both commercial and residential solar systems are increasingly affected by shading caused by pollution. Common issues such as bird droppings, leaf accumulation, and dust buildup can lead to unexpected consequences. Why does partial shading cause an entire panel to overheat? How can a small stain impact the power output of an entire solar system?
Compared to heavy rain or high temperatures, hot spots caused by pollution and shading are more subtle and often overlooked. While they may not cause immediate damage, they gradually build up thermal stress over time, leading to power loss, glass cracking, or even complete panel failure. By the time abnormal power generation is noticed, it is often too late to trace the root cause.
Hot spots triggered by shading and pollution are not random incidents but a structural risk. Without early identification and preventive design measures, these issues will repeatedly occur during high-risk seasons, compromising the safety, stability, and performance of the solar system.
How Do Hot Spots Form in Solar Panels?
A hot spot refers to a localized area of abnormal heating within a solar panel where certain solar cells experience excessive temperature rise. Its cause is not heat itself but shading. When contaminants like bird droppings or fallen leaves cover part of a solar cell, that area can no longer generate power properly. The current is blocked, triggering reverse bias, which turns the affected cell from a power generator into an energy-consuming load, causing localized heating and forming a hot spot.
The problem goes beyond a single cell. To increase voltage output, a solar panel typically contains 60 to 100 cells connected in series, with multiple panels further connected into a string. If just one cell experiences a current limitation, the current in the entire string drops accordingly. Even if only about 5% of the panel surface is shaded, the power output can drop by more than 30%. The more concentrated the shading and the higher the current, the faster the hot spot develops and the greater the temperature rise.
Bypass diodes are designed to activate when shading intensifies, isolating the affected area from the circuit. However, these diodes require a reverse voltage of 0.5 to 0.7V to trigger. In cases of concentrated shading like bird droppings, the hot spot often forms before the bypass diode can respond. If the panel design or operating conditions are not properly optimized, hot spots will occur repeatedly, leading to long-term risks such as encapsulation degradation, solder joint burn-out, or even glass cracking.
What Types of Pollution Are Most Likely to Trigger Hot Spots in Solar Panels?
Bird Droppings
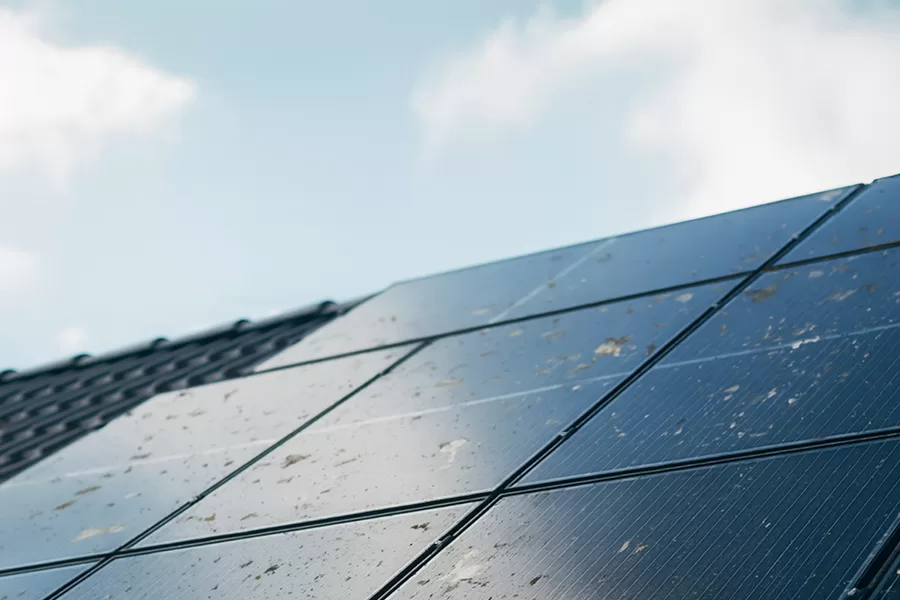
Bird droppings are the most common and highest-risk trigger for hot spots in solar systems. The key problem is not the covered area but the concentrated nature and complete opacity of the shading. A small patch of bird droppings fully covering a single cell can cause severe current blockage in a series circuit.
In a solar panel, all cells are connected in series, meaning the current must remain consistent throughout. When a cell is covered by bird droppings, it can no longer generate power, but the series current is still forced to pass through. This immediately puts the shaded cell into reverse bias, causing it to overheat and form a hot spot.
Additionally, bird droppings have poor thermal conductivity. Once the moisture evaporates, the solid organic material left behind traps heat, leading to significant temperature buildup. According to DNV inspection data, local temperature rises under bird droppings typically range from 35°C to 70°C, significantly higher than other types of pollution. Just one fully shaded cell (about 2% of the panel’s surface area) can cause the panel’s total power output to drop by 25% to 30%, triggering a noticeable hot spot effect almost immediately.
Leaf Pollution
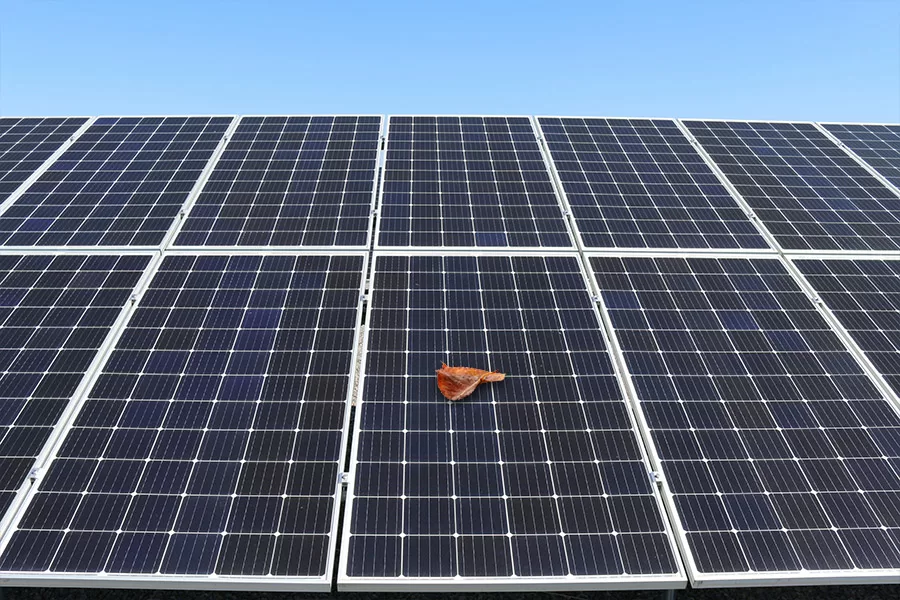
The hot spot risk from leaf pollution differs from bird droppings. It depends on the coverage pattern and duration. An individual leaf typically allows some light transmission (around 20%–40%). When leaves are spread out, the reduction in light leads to lower efficiency, but the internal current in the panel remains balanced, making hot spots less likely.
However, when multiple leaves accumulate, especially when damp, their light transmittance quickly drops below 10%. In this case, several cells within the shaded area enter a low-generation or completely inactive state. The current cannot pass through, triggering reverse bias. According to the IEA PVPS Task 13 report, bypass diode activation is often delayed, particularly in the middle section of the panel, resulting in local temperature rises of 20°C to 40°C.
This risk is highly seasonal. If not removed promptly, accumulated leaves can create multiple distributed hot spots, compromising the operational safety of the entire string.
Dust Pollution
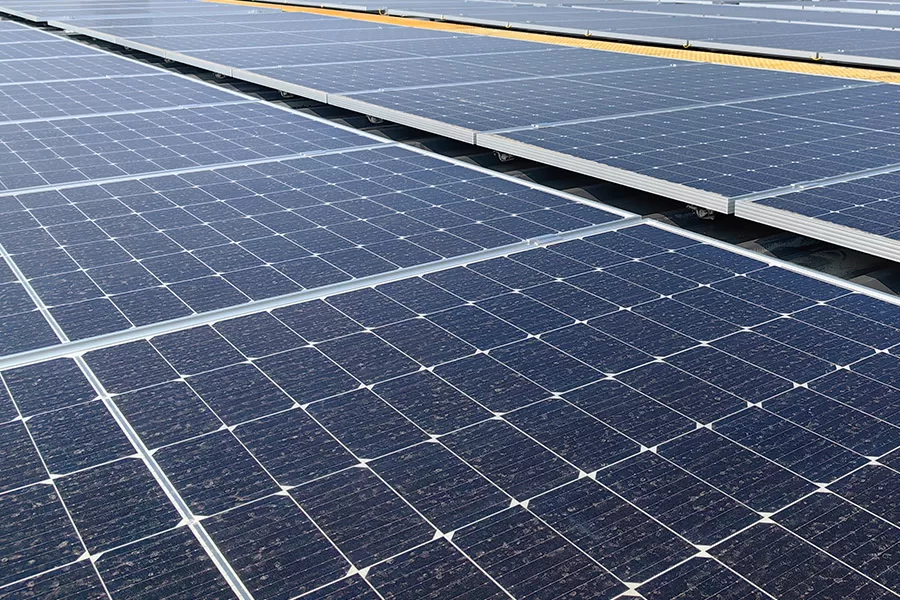
The primary risk of dust pollution is not hot spots, but long-term efficiency loss. Unlike bird droppings or leaves, dust typically spreads evenly across the panel, reducing overall light intensity.
Under evenly reduced light, all cells experience a uniform drop in photocurrent, meaning the current remains balanced, and no reverse bias occurs. Even if 80%–90% of the surface is covered with dust, it does not directly cause hot spots. Thermal imaging usually shows that dust-related temperature differences are less than 5°C.
NREL research on PV soiling losses indicates that dust generally reduces system power output by 3%–7%. However, when combined with other localized contaminants like bird droppings or moss, dust can contribute to the formation of hot spots, leading to long-term performance degradation.
Moss Pollution
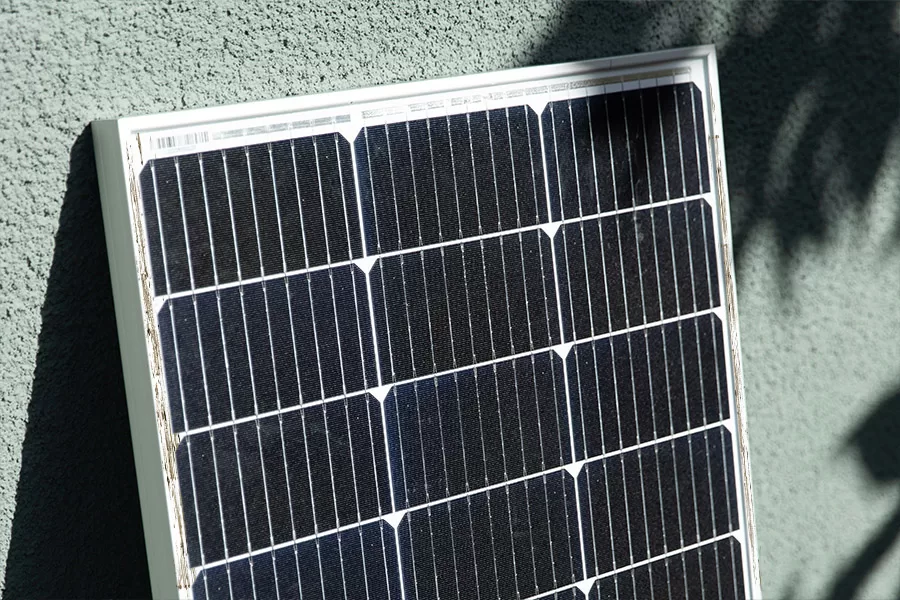
Moss poses a risk due to its fixed location, long-lasting coverage, and high heat retention. Moss typically grows in water-accumulating areas around panel frames, creating semi-permanent localized shading without strong seasonality.
The electrical behavior is similar to bird droppings — the cells under moss experience sustained current limitations, while the series current continues to pass, causing persistent reverse bias. Additionally, the high moisture content inside moss and its poor thermal conductivity result in continuous heat buildup in the affected area.
Thermal imaging data from TÜV Rheinland shows that cells shaded by moss commonly experience temperature rises of 25°C to 35°C. This type of chronic hot spot not only reduces energy output but also accelerates encapsulation aging, solder joint burn-out, and can even lead to the development of microcracks in the glass.
Common Types of Pollution and Their Typical Characteristics
| Pollution Type | Shading Pattern | Peak Season | Common Locations |
|---|---|---|---|
| Bird Droppings | Highly concentrated point shading | All year | Ridges, edges, high points, protrusions |
| Fallen Leaves | Large area, piled coverage | Autumn and winter | Near vegetation, roof depressions |
| Dust | Even coverage | Spring, all year | Open areas, near roads, arid regions |
| Moss | Fixed frame edge shading | All year | Poor drainage areas, damp zones, north-facing sides |
How Do Hot Spots Impact Solar Systems?
Power Loss: Continuous Output Decline
Hot spots are a major cause of continuous power loss in solar panels. Once a local cell enters reverse bias, it stops generating electricity and instead becomes a constant energy-consuming load. This not only causes localized failure but also amplifies the problem across the entire series circuit. When one cell is restricted, the string current is forced to drop, leading to a noticeable drop in panel output.
Even if the shading covers only 2%–5% of the panel area, power output commonly drops by 20%–35%. If multiple hot spots occur, the total string output loss can exceed 40%. This degradation is not random but recurs as shading pollution happens seasonally, gradually compounding and eroding the system’s long-term performance.
More critically, with repeated hot spot effects, the annual energy yield of the PV system typically declines by 5%–10%. A small localized issue can escalate into string-level or even system-level continuous productivity loss, potentially triggering secondary electrical failures.
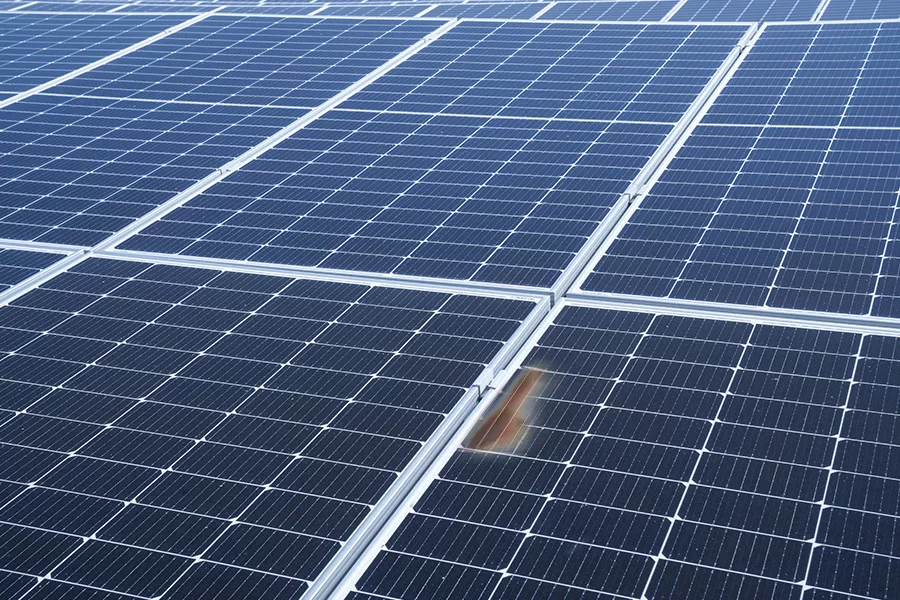
Encapsulation Damage: Accelerated Material Aging
The persistent high temperatures caused by hot spots are a primary driver of accelerated encapsulation aging. When local temperatures remain above 60°C for extended periods, they directly trigger the thermal degradation of encapsulation materials. This begins with yellowing and cross-linking failure, progressing to bubbling and delamination, forming an irreversible chain of material deterioration.
Delamination leads to the failure of structural protection and a continuous decline in light transmittance. The cavities formed in the hot spot area expand over time, creating pathways for moisture ingress. Moisture-induced corrosion further worsens solder joint fatigue and busbar fractures, accelerating both material aging and electrical failure.
Hot spot aging tests by TÜV Rheinland and NREL show that bubbling and delamination typically occur within 12–24 months under hot spot stress, far earlier than the normal aging curve of 8–10 years for standard panels. More concerning, encapsulation failure caused by hot spots often starts internally, invisible from the outside, ultimately undermining the panel’s optical performance, structural stability, and long-term output capacity.
Electrical Failures: Solder Joint Burn-Out and Open Circuits
Hot spots not only cause material degradation but also seriously affect the electrical integrity of solar panels. Localized high temperatures stress solder joints, fingers, and busbars, leading to thermal fatigue in metal materials. Under sustained thermal loads of 90°C to 120°C, solder begins to recrystallize, crack, and burn, significantly weakening solder joint reliability.
As solder joints deteriorate, the metal fingers and busbars also suffer from thermal stress and current load, leading to fractures. Once the current path is interrupted, bypass diodes are forced to engage frequently, causing local current diversion and further power loss. Eventually, open circuits cause panel disconnection, string voltage imbalance, and even ground faults.
According to DNV and PVEL inspection reports, more than 18% of hot spot-failed panels exhibit solder joint burn-out, finger breakage, or busbar melting. Compared to natural aging, hot spot-induced electrical degradation happens faster and spreads more aggressively, often escalating from a single-point failure to a string-level electrical fault.
Structural Damage: From Microcracks to Shattering
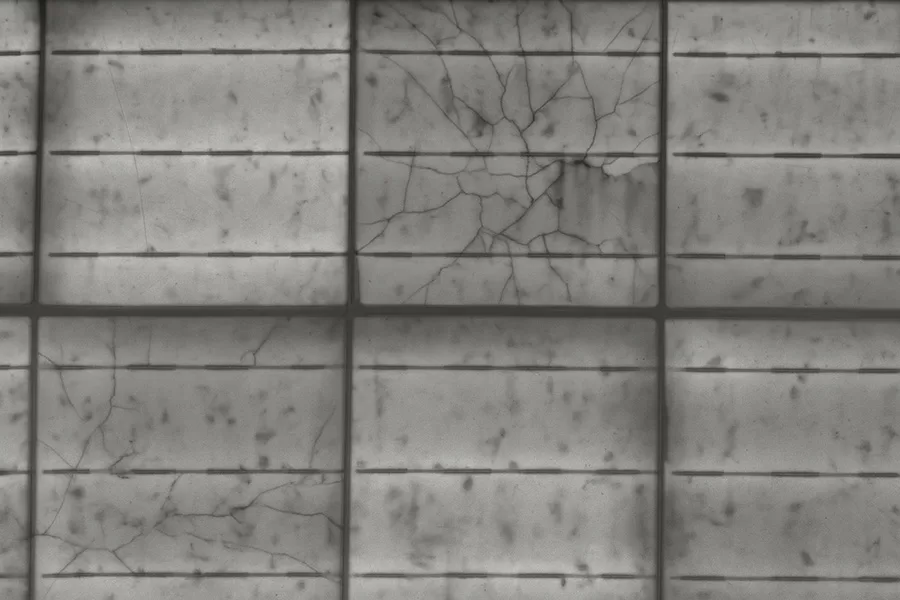
The localized high heat caused by hot spots affects not only electrical and encapsulation components but also threatens the structural integrity of the panel. Persistent thermal stress on the glass, cells, and solder joints triggers thermal expansion and contraction cycles, leading to concentrated mechanical stress. In conditions with large day-night temperature swings or extreme weather, the hot spot area becomes a structural weak point.
Through this thermal-mechanical cycling, cells develop microcracks that propagate along stress lines. As cracks expand, the encapsulation begins to tear, the frame starts to warp, and the glass develops edge cracks or central fractures. What starts as microcracks can eventually escalate to glass shattering, encapsulation rupture, and complete structural failure.
According to DNV and PVEL field inspection data, panels with hot spots are 2.5 times more likely to develop glass microcracks compared to normal panels. Around 12% of these cases progress to visible cracks or complete breakage. This type of structural failure reduces light transmittance and allows continuous moisture ingress, compounding with encapsulation failure and electrical degradation, ultimately shortening the panel’s lifespan significantly.
Hotspot Impact and Engineering Consequences Comparison Table
| Risk Category | Typical Symptoms | System Impact | Engineering Consequences |
|---|---|---|---|
| Power Loss | Power generation anomalies, string imbalance | Current mismatch, frequent bypass activation | Annual power loss 5%–10% |
| Encapsulation Heat Damage | Bubbling, delamination, yellowing | Reduced light transmission, sealing failure | Material degradation, shortened lifespan |
| Electrical Failure | Solder joint burn-out, busbar breakage, disconnection | Current interruption, voltage imbalance | String failure, system disconnection |
| Structural Damage | Microcracks, glass breakage | Structural instability, water leakage failure | Safety risks, module replacement |
How to Detect and Manage Hot Spots?
Identify Hot Spots Through Data and On-site Signals
Hot spots are usually detected through abnormal power performance and physical defects. The most direct signal is power loss, typically seen as string output significantly lower than neighboring strings. Current imbalance is another typical sign — the DC current drops abnormally without matching factors like orientation, shading, or system configuration. Inverters often report errors like “string power imbalance” or “DC abnormality”. On the IV curve, typical indicators include current shoulder collapse, reverse pull-down, and bypass diode activation, all signaling electrical performance degradation.
On-site signals include localized pollution (such as bird droppings, leaves, moss), encapsulation bubbling, delamination, moisture ingress, as well as glass microcracks and frame deformation. When pollution coincides with power anomalies, it often indicates a pollution-induced hot spot. If encapsulation defects are accompanied by continuous current abnormalities, this suggests a structural or electrical hot spot. In contrast, even dust coverage only causes overall output reduction without forming hot spots. By cross-referencing data anomalies with physical observations, suspected hot spot modules can be quickly identified.
Confirm Hot Spot Location and Cause Using Diagnostic Tools
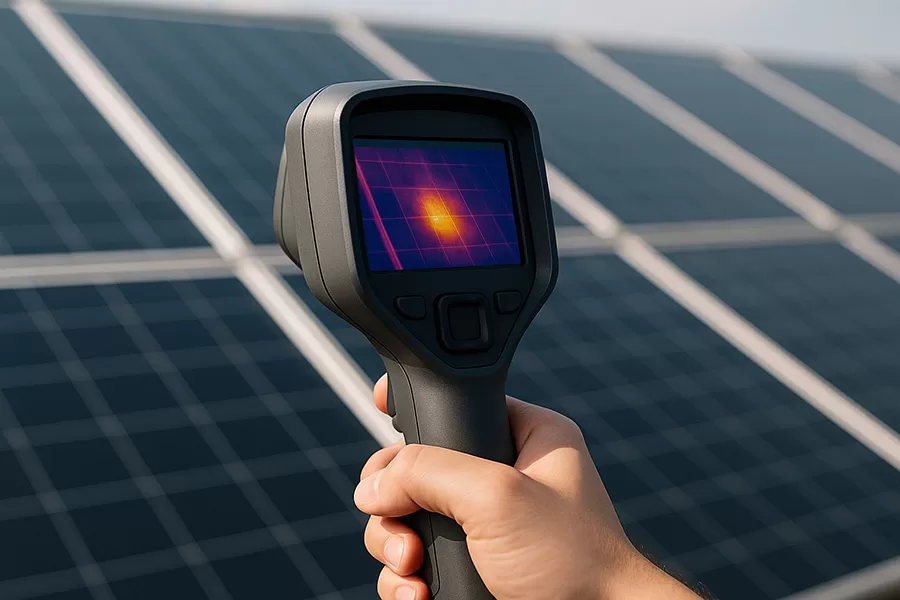
Thermal imaging is the most direct method for confirming hot spots. A surface temperature difference of ≥10°C is typically classified as a suspected hot spot, while differences below 5°C are usually attributed to general heat dissipation variance. Testing should be conducted on sunny days under high load conditions to avoid misinterpretation due to low irradiance.
EL (Electroluminescence) Testing identifies invisible defects like microcracks, broken fingers, or encapsulation delamination, useful in the early stages of hot spots or structural failures.
IV Curve Analysis focuses on electrical abnormalities. Indicators like current shoulder collapse, reverse pull-down, or bypass diode activation are typical, though this method cannot pinpoint the physical location — it confirms whether there is current mismatch or bypass failure.
Drone-based infrared inspections are widely used in large-scale PV plants for fast detection of thermal anomalies. In rooftop distributed projects, handheld thermal cameras are the primary tool, combined with EL to confirm structural issues and IV analysis to verify electrical faults.
By integrating thermal imaging data, IV curve diagnostics, and structural imaging results, hot spots can be accurately traced to pollution shading, structural defects, or electrical failures, providing clear guidance for subsequent corrective actions.
Choose the Right Treatment Based on the Cause of the Hot Spot
Regardless of the cause, the general principle is:
Pollution-induced hot spots can be repaired; structural and electrical hot spots must be replaced.
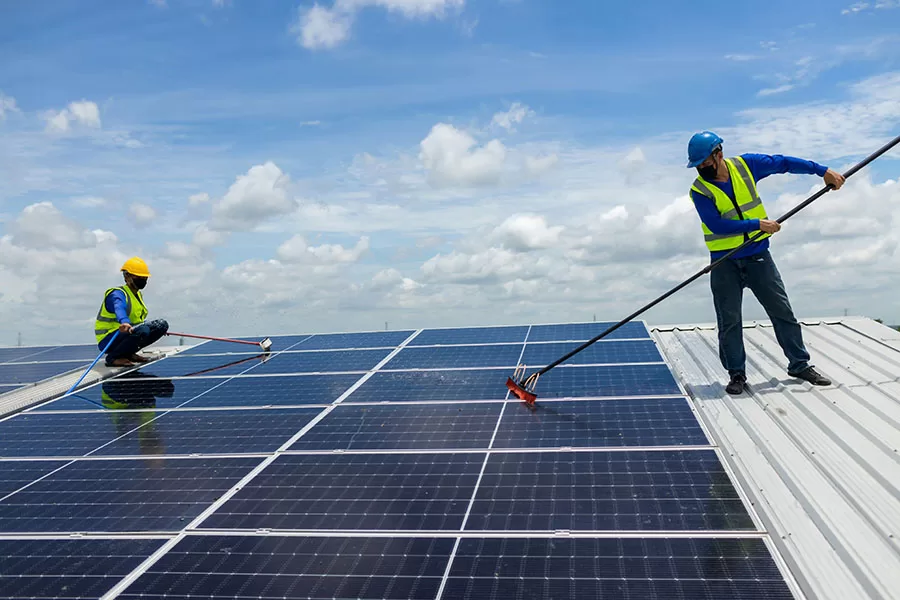
Pollution-type hot spots are a reversible risk, resolved through frequent cleaning and targeted maintenance. If pollution is recurring — especially on rooftops, protrusions, or damp drainage areas — it is recommended to install anti-bird devices or improve drainage systems.
Structural hot spots, such as encapsulation bubbling, delamination, or microcracks, are irreversible failures. Once confirmed, the module must be replaced immediately. Continuing operation will only accelerate material degradation and electrical damage.
Electrical hot spots, often due to solder joint burn-out, busbar fractures, or bypass diode failure, can be temporarily isolated with bypass fixes. However, any electrical failure accompanied by high temperatures must be replaced immediately to prevent escalation.
Establish a Hot Spot Prevention and Risk Control System
The key to hot spot prevention is eliminating root causes and maintaining a continuous risk monitoring loop. A complete risk control framework relies on two layers:
Environmental and structural protection
Early fault detection and timely decommissioning
For pollution-induced risks, regular cleaning, proper drainage, and anti-bird measures are critical to reducing recurrence. For structural and electrical risks, strict control over module quality and installation standards is essential. Eliminating stress concentration and welding defects during construction is a key preventive measure.
Operations and maintenance should combine routine thermal imaging scans with annual in-depth diagnostics to maintain continuous monitoring and ensure long-term system stability.
How to Systematically Prevent Hot Spots in Solar Systems?
1. Prevent Hot Spots Through Module Design
The structure of a solar module determines whether shading will lead to hot spots. Modules designed with cell-splitting, multi-busbar, or full-back-contact (IBC) technology can effectively distribute local current mismatch and reduce hot spot risks.
Triple-cut cells further subdivide electrical zones, limiting the impact of shading to a much smaller area.
Multi-busbar designs provide more current pathways, preventing current concentration.
Half-cut cells reduce current density by splitting current into parallel branches.
IBC (Interdigitated Back Contact) modules have the shortest current paths and no front-side shading, offering the highest shading tolerance currently available.
Bifacial glass-glass modules do not have an internal anti-hot-spot electrical design but can offer partial compensation for front-side shading losses if the rear side has high reflectivity.
Performance Comparison of Mainstream Module Structures Under Shading
| Module Structure/Technology | Anti-Shading Mechanism | Power Loss Under Shading |
|---|---|---|
| Triple-cut + Multi-busbar | Finer current paths, smaller partitions, lower mismatch risk | Shading 1/3 of the module, power drops by 10–15% |
| Half-cut + Multi-busbar | Current parallel diversion, reduced current density | Shading 1/2 of the module, power drops by 15–25% |
| IBC Full Back Contact | No front busbars, ultra-short current paths, minimizes mismatch | Same shading, power drops by 8–12% |
| Bifacial Glass-Glass (Supplementary) | Rear-side generation compensates for front-side shading losses | Light shading, compensation 5–10% |
• Power loss data is based on standard test conditions (STC): front irradiation 1000W/m², ambient temperature 25°C, no wind, module operating at maximum power point, without local optimization (no micro-inverters or optimizers);
• Shading mode is single-sided front shading, simulating typical scenarios like bird droppings, fallen leaves, and rooftop shadows;
• Power loss reflects the instantaneous DC output drop of a single module under shading, excluding system-level MPPT dynamic optimization compensation;
• The term "supplementary" for bifacial glass-glass refers to its anti-shading effect relying on rear-side power generation to compensate for front-side shading, rather than the module's internal electrical design having inherent mismatch tolerance. If there is no effective rear-side reflection, the compensation effect approaches zero and does not reduce hotspot risks;
• Data is sourced from DNV, TÜV, PVEL, NREL, IEA PVPS Task 13 reports, and shading field tests and operational statistics from multiple module manufacturers.
2. Reduce Hot Spot Risk Through Installation and Layout
Installation and layout are critical steps in hot spot prevention. Most shading comes from rooftop structures, surrounding environments, or pollution buildup over time. A well-planned array layout with proper site protection can greatly reduce the likelihood of hot spots.
During installation, the main risks come from shading and pollution. Common shading sources include roof ridges, parapets, vents, exhaust pipes, nearby buildings, or trees. Shading also changes dynamically with the seasons, solar elevation angles, or plant growth. Arrays should avoid these high-risk zones — especially roof ridges, protrusions, and drainage channels. It is recommended to maintain a 30–50 cm clearance from any elevated structures to ensure uniform sunlight across the string and avoid current mismatch caused by localized shading. For rooftops with unavoidable fixed shading, the layout should be optimized by adjusting array placement or excluding shaded areas.
During system operation, pollution-induced hot spots remain a significant concern. Installing anti-bird spikes, leaf guards, and ensuring smooth drainage can effectively reduce hot spot risks caused by debris accumulation. North-facing or shaded roofs should be regularly inspected for moss growth. For scenarios where shading cannot be fully avoided, using multi-MPPT inverters, micro-inverters, or optimizers can help mitigate power losses caused by shading. However, these electrical optimizations only improve output — they do not eliminate the risk of hot spots.
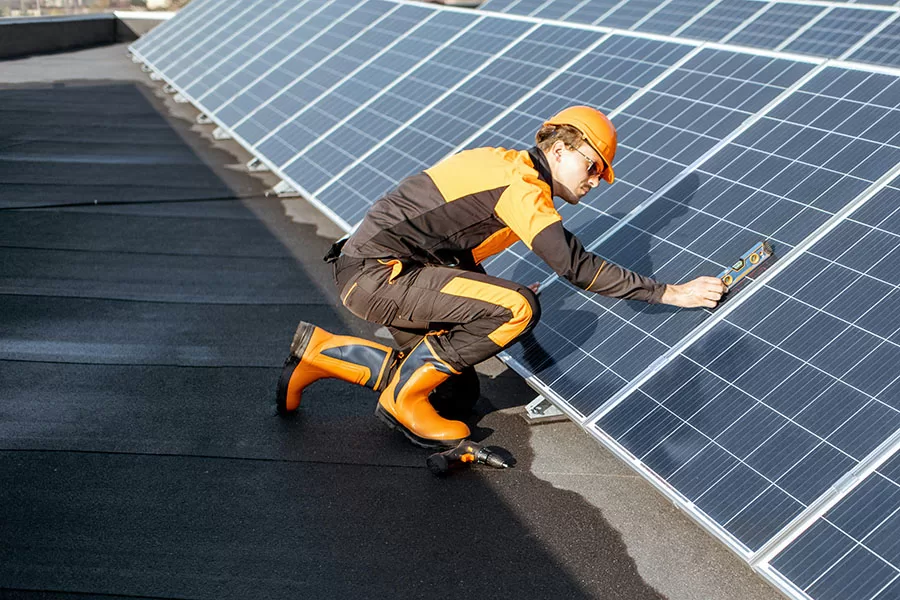
3. Implement Operation & Maintenance Mechanisms for Long-term Risk Control
According to operations data from DNV and IEA PVPS Task 13, regular cleaning can reduce the incidence of pollution-induced hot spots by approximately 70%, effectively mitigating temperature rise and power loss caused by bird droppings or leaf shading during autumn and winter.
However, pollution is only one of several triggers. Hot spots are not random occurrences; they are structural risks driven by environmental changes, module aging, material degradation, and electrical stress — persisting throughout the system’s entire lifecycle. Compared to static design optimization, maintenance plays a more critical role in dynamically managing these long-term risks.
In real-world operations, pollution-related hot spots and structural/electrical hot spots exhibit completely different risk profiles:
Pollution-type hot spots are driven by seasonal and environmental factors, requiring frequent inspections and immediate cleaning for ongoing mitigation.
Structural and electrical hot spots stem from material fatigue, current mismatch, or manufacturing defects, requiring regular in-depth diagnostics and early interventions to control.
Without effective management, hot spots will evolve from localized thermal anomalies into encapsulation degradation, solder joint burn-out, and current mismatch, eventually causing string disconnection and leading to long-term structural power losses across the system.
An effective maintenance framework forms the core risk control loop for hot spot management. This involves more than just surface cleaning or repairing faults — it requires multi-dimensional monitoring, including thermal imaging, EL testing, and IV curve analysis, to continually quantify anomalies, track risk evolution, and dynamically adjust inspection frequencies, diagnostic strategies, and failure response protocols. This ensures the system’s thermal stability and electrical integrity over time.
Under current solar asset management standards, hot spot risk is formally recognized as a key structural factor affecting power generation, accelerating module degradation, increasing maintenance costs, and reducing asset value. Without a closed-loop management system, this risk will inevitably continue to spread along the curves of performance decay and cost escalation.
Hot spot management is no longer just an O&M strategy — it is a core capability within the solar system health management framework. Through a combination of module design optimization, layout refinement, and closed-loop maintenance strategies, hot spot risks can be transformed from a system failure factor into a monitorable, controllable operational boundary condition — a critical prerequisite for ensuring the stability of both energy yield and asset value throughout the solar system’s lifecycle.
Since 2008, Maysun Solar has been both an investor and manufacturer in the photovoltaic industry, providing zero-investment commercial and industrial rooftop solar solutions. With 17 years in the European market and 1.1 GW of installed capacity, we offer fully financed solar projects, allowing businesses to monetize rooftops and reduce energy costs with no upfront investment. Our advanced IBC, HJT and TOPCon panels, and balcony solar stations, ensure high efficiency, durability, and long-term reliability. Maysun Solar handles all approvals, installation, and maintenance, ensuring a seamless, risk-free transition to solar energy while delivering stable returns.
Reference
DNV. (2021). PV Module Reliability Scorecard 2021. DNV Energy Systems. https://www.dnv.com/services/pv-module-reliability-scorecard-2021-200178
PVEL. (2023). PV Module Reliability Scorecard 2023. PV Evolution Labs (PVEL). https://www.pvel.com/pv-module-reliability-scorecard/
NREL. (2022). Impact of Soiling on PV System Performance: Review and Analysis. National Renewable Energy Laboratory. https://www.nrel.gov/docs/fy22osti/82015.pdf
IEA PVPS Task 13. (2020). Soiling of Photovoltaic Panels: Literature Review, Measurement, and Modeling. International Energy Agency. https://iea-pvps.org/research-tasks/task-13/
TÜV Rheinland. (2021). Quality Monitor: Global PV Module Reliability Testing. TÜV Rheinland Group. https://www.tuv.com/media/corporate/products_1/renewables_1/solar/solar_quality_monitor.pdf
Recommend Reading
How to Size a Commercial Rooftop Solar System: A Practical Guide for EPCs
For commercial and industrial (C&I) rooftop solar projects, the maximum number of panels a roof can accommodate does not necessarily determine the most suitable system size. A factory may have sufficient roof space for a large PV installation, but its electricity consumption, grid
5400 Pa Snow Load: How to Choose PV Modules with 30 mm or 35 mm Frames
For PV projects in Alpine and other high-snow-load regions in Europe, selecting a module based only on a “5400 Pa” rating or a 30 mm vs 35 mm frame height is not enough. A more reliable approach is to first determine the project-specific snow load
Carbon Footprint and LCA in European C&I Solar: Why EPCs Should Check Before Module Procurement
Solar power is widely regarded as a low-carbon energy source. However, generating electricity from solar energy and manufacturing a low-carbon solar module are not quite the same thing. Before a photovoltaic module leaves the factory, it passes through multiple manufacturing stages, including silicon
HEMS and Dynamic Electricity Pricing: From Solar Generation to Smart Energy Management
For years, home solar systems have focused on one main question: How much electricity can my rooftop solar system generate? But as home batteries, smart meters, electric vehicles and flexible electricity tariffs become more common, residential energy management is entering a new phase.
Maysun Solar’s First 3.5 MW Solar EPC Project in Italy Enters Its Final Stage
A large-scale commercial and industrial rooftop solar project with a total capacity of approximately 3.5 MWp is now entering its final stage in the Turin area of Piedmont, Italy. Around 8,000 solar modules planned for the project have now been fully installed.

August European Solar Industry News
In August 2026, Europe’s solar market combined record PV generation with volatile power prices driven by heat, gas costs and low wind output. Policy support also expanded, including 800 W plug-in solar in Great Britain and greater EU flexibility for PV and storage investments, while module prices largely stabilized amid renewed oversupply.